
Wondering whether bikes really change a city? Urban cycling mobility works best when protected lane networks connect, and research links them to lower emissions, lower travel costs and fewer road deaths. Here is the evidence, and what it means for you.
| Key fact | Value |
|---|---|
| Emissions prevented by Bogotá’s protected lane network | About 22,000 tonnes of CO2-eq per year |
| Emissions prevented by Guangzhou’s protected lane network | About 16,000 tonnes of CO2-eq per year |
| Estimated build cost of Bogotá’s network | 132 million USD |
| Estimated total yearly benefit of Bogotá’s network | 310 million USD per year |
| Median city: effect of each new km of bicycle lanes | About 13,400 additional km per year of bicycle travel |
| Emissions cut per dollar: protected lanes versus metro rail | Metro rail is outperformed by a factor of ten |
These figures come from the FIA Foundation’s October 2022 report summary and a UCLA Institute of Transportation Studies paper. They are modelled estimates and can change, so check the source before you rely on them.
Why connected protected lanes drive urban cycling mobility
The Institute for Transportation and Development Policy (ITDP) says connected networks of physically protected bicycle lanes, rather than disconnected, unprotected lanes or other policy measures, are the most important factor in increasing cycling, as set out in its October 2022 report page. Design details have their own page on protected bike lanes.
The report examined Bogotá, Colombia and Guangzhou, China. Using cyclist counts and intercept surveys, it estimates that these networks prevent about 22,000 tonnes of CO2-eq per year in Bogotá and 16,000 in Guangzhou, as the FIA Foundation summary explains. In each city that is equivalent to the carbon sequestered by planting 300,000 to 400,000 new trees every year.
The cost side is where the report makes its sharpest comparison. According to the full report, the lanes deliver:
- roughly 10 times as much greenhouse gas reduction per dollar of infrastructure spending as metro rail systems;
- slightly more reduction per dollar than bus rapid transit;
- a clear contrast with highways, where the FIA Foundation summary says every 200 USD spent creates one tonne of GHG emissions per year, while the same spend on protected lanes mitigates almost exactly that amount.
That does not make metro rail unimportant. The FIA Foundation summary calls it an essential part of sustainable urban transportation; it is simply outperformed by a factor of ten on emissions reduced per dollar spent, per the same source.
Speed matters too. The same summary says protected lane networks can be built much more quickly than rapid transit, with implementation taking a few years or less rather than decades (FIA Foundation, 24th October 2022).
Do protected lane networks pay for themselves?
The ITDP-led study says these networks create more economic value each year than they cost to build, and pay for themselves in less than a year. The figures below are the FIA Foundation’s reported estimates for the two case-study cities.
| City | Estimated build cost | Savings to travellers per year | Deaths prevented per year | Total benefit per year |
|---|---|---|---|---|
| Bogotá | 132 million USD | 80 million USD | 300 | 310 million USD |
| Guangzhou | 69 million USD | 30 million USD | 50 | 105 million USD |
Those totals are conservative by the authors’ own description. The estimates do not include time savings, reduced air pollution, land value uplift or other aspects of the economic benefits of cycling (FIA Foundation).
If you want to test the idea on a local plan, ITDP developed a free SCOPE modelling tool, available in Excel, to predict the climate impacts of any proposed bicycle lane development, according to its publication page. The research sits within ITDP’s Cycling Cities campaign, which the report says was launched in 2021.
What shapes cycling in a city: density, terrain and street design
A UCLA team used Google Environmental Insights Explorer data to study walking and cycling in 11,587 cities from 121 countries, in a paper listed on June 9, 2025. It is one of the broadest looks at the question so far.
At city level, population density has the largest effect on walking and a positive effect on cycling, because higher densities bring destinations within walking and cycling distance (UCLA ITS). Bicycle lanes also help: in the median city, each new km is associated with about 13,400 additional km per year of bicycle travel.
The authors then simulated a scenario in which every city expanded its bicycle network to the level of Copenhagen, Denmark. Their simulations indicate private vehicle emissions about 6% lower and health benefits of about US$435 billion per year, according to the same paper. Treat that as a modelled upper-range scenario, not a forecast.
Weather and hills come up in almost every conversation about cycling. The UCLA paper finds that harsh winter or summer climates are not a major barrier at the annual level, although steep terrain discourages cycling (UCLA ITS). If wet days worry you, there is a practical page on commuting by bike in the rain, and if hills are the sticking point, e-bike vs regular bike commuting sets out the trade-offs.
Protected lanes are not the only model. The paper highlights cities such as Osaka, which has less extensive walking and cycling infrastructure but a network of narrow streets with slow-moving traffic where different road users coexist (UCLA ITS).
How does urban cycling affect air quality and health?
A European Cyclists’ Federation study, listed by the Safe Routes Partnership in 2016, simulated shifts in mode share in five European cities. Modelling a 23% increase in cycling mode share:
- reduced projected NOx emissions by 16-27%, varying by city;
- reduced projected PM10 emissions by 4-19%;
- cut disability per 10,000 residents by 4-50 years in three cities, through improved air quality (Safe Routes Partnership).
Many urban trips are short. A 2014 evidence summary notes that in Great Britain 67% of all trips are less than 5 miles in length, and 18% are less than one mile. That is the pool of trips where a bike is a realistic option, and it is why the commute is a natural starting point: the benefits of cycling to work are a good place to begin.
The same summary describes New Zealand modelling of moving short urban car trips (7 km or less) to bicycles. At a 10% shift of vehicle kilometres, it estimates 11.3 fewer deaths a year and hospital savings of £7,041,299; at 30%, 33.9 fewer deaths (TravelWest).
The modelling was limited to adults, so the summary says the estimates probably underestimate the true benefits, since children’s respiratory health could gain more. For the wider climate picture, see the page on cycling carbon emissions.
What else makes cycling work day to day?
The studies above focus on infrastructure and trip shifts. Everyday cycling also involves practical choices, and these pages cover the common ones:
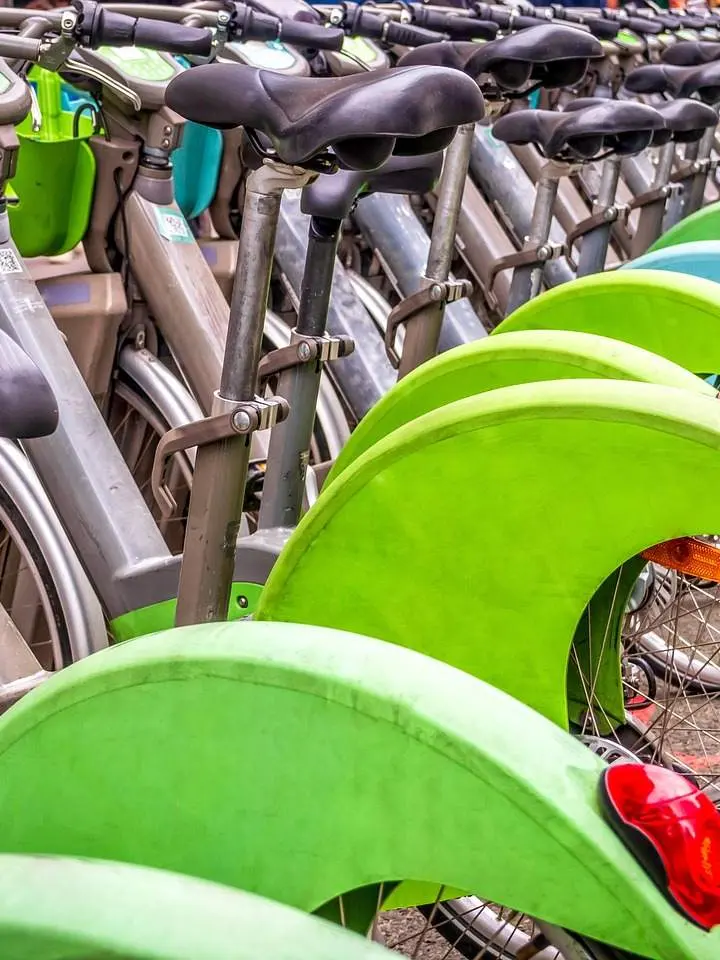
- Readers curious about borrowing a bicycle can start with how bike share programs work.
- Families weighing a bike for school runs and shopping can read about cargo bikes for families.
- Anyone parking in public should read how to lock a bike.
- Choosing what to wear is covered in the guide to sustainable cycling clothing.
Cycling is also a community and enterprise topic. The related hub on social enterprise cycling looks at that side of the picture.
How far can you trust these numbers?
Read the evidence with its limits in mind. The lane study covers two middle-income cities and dates from October 2022, and the authors present it as one of the first empirical measures of its kind in low- and middle-income countries (ITDP).
The Copenhagen scenario, the European air-quality results and the New Zealand health estimates are all simulations. They show direction and scale, not guarantees for any one street. Your own city’s density, hills and traffic will change the result, which is why the free modelling tool exists.
Frequently asked questions
Do protected bike lanes reduce emissions?
Show answer
An ITDP-led study estimates that protected lane networks prevent about 22,000 tonnes of CO2-eq per year in Bogotá and 16,000 in Guangzhou, as reported by the FIA Foundation in October 2022. These are estimates for two middle-income cities.
Does bad weather or hilly terrain rule out cycling?
Show answer
Weather matters less than many people expect. Across a full year, extreme heat or cold is not a major barrier in the UCLA analysis; steep hills are the exception, because they discourage riding.
Can you model a bike lane network for your own city?
Show answer
ITDP’s October 2022 publication page describes a free SCOPE modelling tool in Excel that predicts the climate impacts of a proposed bicycle lane development.
How many trips are short enough to cycle?
Show answer
Quite a lot of them, at least in Great Britain. A 2014 evidence summary reports that 67% of trips cover under 5 miles and 18% under one mile; other countries will differ.