Wondering how bike share programs work before you try one? You unlock a shared bike at a docking station or on the street, ride it, then return it. Pay with a pass or as a one-time user.
This guide is part of the wider topic of urban cycling mobility, and looks at how shared bikes fit into city travel.
| Item | Value |
|---|---|
| U.S. bike share trips in 2017 | 35 million trips |
| Trip growth over 2016 | 25% |
| U.S. bike share bikes by the end of 2017 | About 100,000 bikes |
| Dockless share of all bike share bikes, end of 2017 | About 44% |
| Station-based systems, average use | 1.7 rides per bike per day |
| Dockless systems, average use | About 0.3 rides per bike per day |
These figures come from NACTO’s report Bike Share in the U.S.: 2017. They describe 2017 and can change, so check the source before you rely on them.
What a bike share system is and how a trip works
A bike share system lets people borrow a bike for a single trip instead of owning one. NACTO counted 35 million trips on U.S. bike share bikes in 2017, which was 25% more than in 2016. Since 2010, 123 million trips have been taken on bike share bikes in the U.S., according to the same report.
Most systems follow the same basic steps:
- Find a bike, either at a station or, in a dockless system, on the street.
- Pay for access. Station-based systems offer annual or monthly passes, and they also serve one-time users.
- Ride to your destination.
- Finish the trip by following the operator’s rules for where a bike can be returned or left.
The exact prices and rules differ by city and operator. Check the operator’s own app or website for the current details where you live.
Station-based and dockless systems compared
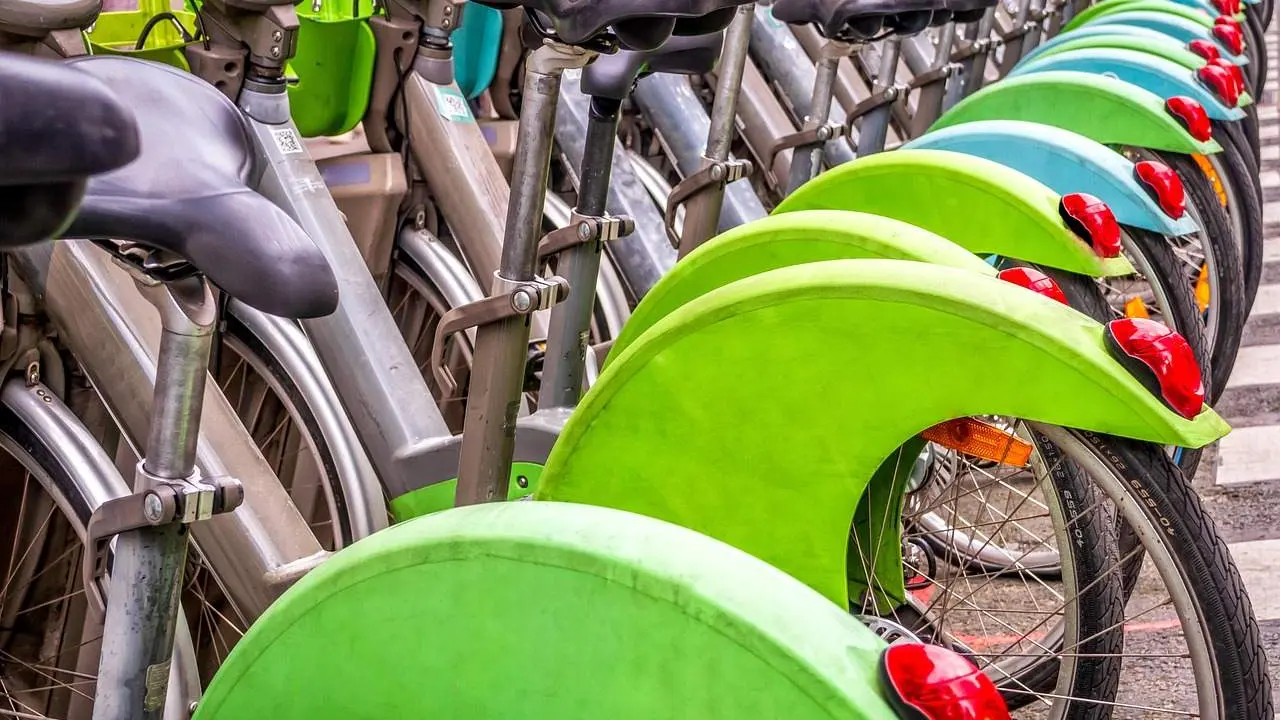
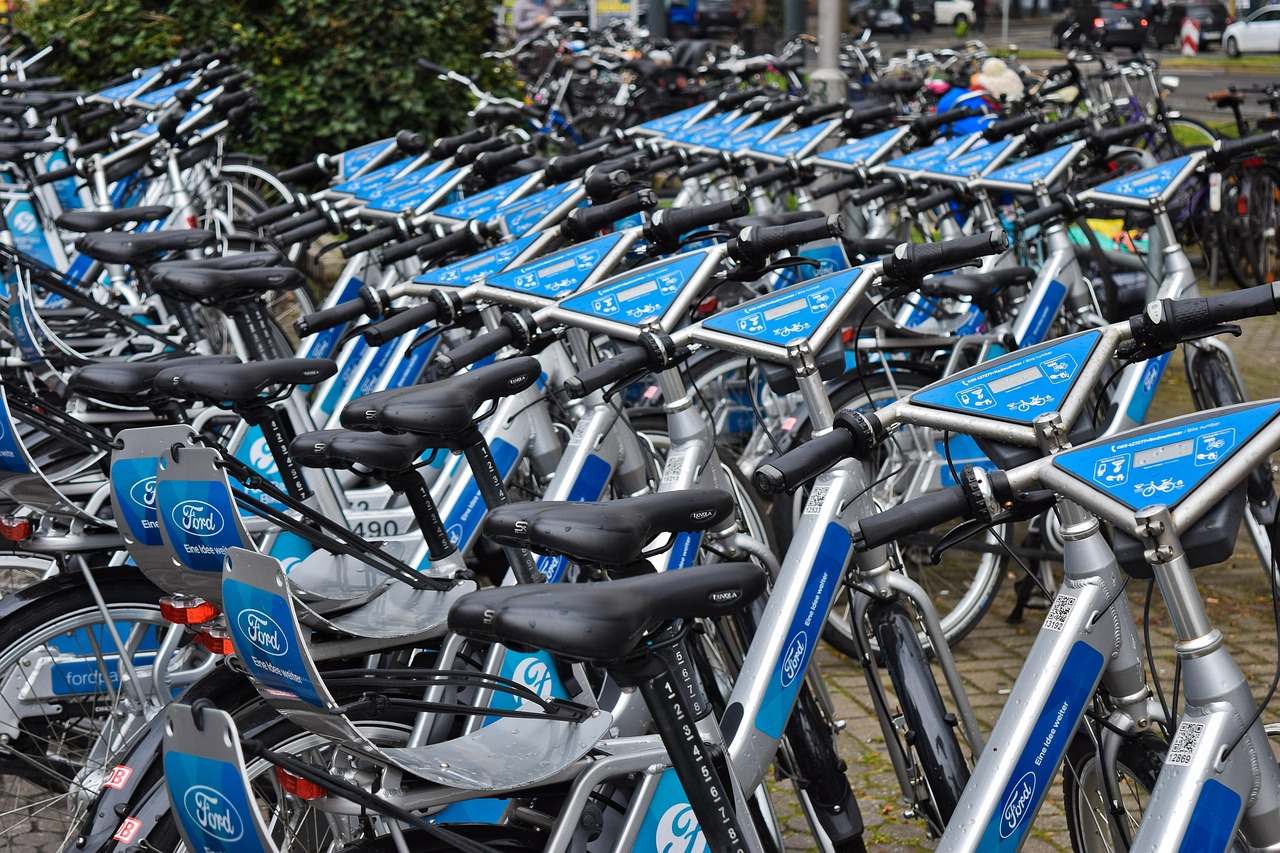
The older model is station-based: bikes live in fixed docks, and you take one from a station and return it to a station. A newer customer interface, commonly known as dockless bike share, appeared in the U.S. in 2017.
The dockless rollout was uneven. After a series of unpermitted systems launched and subsequently closed in various cities, numerous cities responded with pilot programs to permit dockless operations, as NACTO reported for 2017. By the end of 2017, five major dockless companies reported operating in approximately 25 cities and suburbs.
The two models grew at different speeds that year:
- The number of bikes in the U.S. more than doubled, from 42,500 at the end of 2016 to about 100,000 by the end of 2017.
- Station-based systems added approximately 14,000 bikes, bringing the 2017 total to 54,000 station-based bikes.
- During the second half of 2017, dockless companies introduced around 44,000 bikes.
- As of the close of 2017, dockless bikes made up about 44% of all bike share bikes in the U.S.
Seattle shows how a city can test the dockless model. The city launched a pilot program in July 2017, and at the end of 2017 it included four dockless companies and approximately 9,000 bikes.
How much are shared bikes actually used?
NACTO uses rides per bike per day (r/b/d) to compare how hard each bike works. U.S. station-based systems averaged 1.7 r/b/d in 2017, while dockless systems nationally averaged about 0.3. An analysis by the University of Washington, which adjusted for a changing number of bikes, found 0.8 in Seattle over its six-month pilot.
The large influx of dockless bikes had not yet translated into substantial mobility gains in that report. NACTO estimated that up to 1.4 million trips were made on dockless bikes in the U.S. in 2017, about 4% of trips.
Use is also concentrated. Four large station-based systems (Citi Bike in New York City, Divvy, Capital Bikeshare and Hubway) generated the majority, 74%, of all rides in the United States in 2017. Even so, newer systems drew riders quickly:
- Biki in Honolulu launched in July 2017 and became the eighth most heavily used system in the U.S., with 365,000 rides taken to date.
- Detroit’s MoGo system saw 112,000 trips in six months, including during some of the lowest November and December temperatures on record.
- Philadelphia’s Indego system increased ridership by 84% over 2016.
Making bike share affordable
Cost keeps many people out of bike share, so some cities now subsidise access. Among cities with station-based systems, 32% had an income-based discount program, using income thresholds or living in affordable housing as criteria. That was a 33% increase over 2016, when about a quarter of cities had one.
Two examples from the NACTO report show the approach:
- Philadelphia: a $5 AccessPass was offered to Pennsylvanians receiving food assistance. In 2017, AccessPass sales made up about 15% of all sign ups, and AccessPass users took 9% of all trips.
- Detroit: MoGo launched with a $5 annual AccessPass for Detroiters who receive state food assistance. After six months, AccessPass sales made up 18% of all long-term pass sales.
In New York City, Citi Bike completed its fifth year of offering $5/month annual memberships to New York City Housing Authority residents and select community-based credit union members. The number of those residents using Citi Bike nearly doubled in 2017, to 1,500 active members.
Who runs the systems, and what the data can show
From 2010 to 2016, most U.S. bike share equipment and services came from three major companies: B-Cycle, Motivate and Social Bicycles. By the end of 2017, five new major dockless companies had opened systems: Jump (formerly Social Bicycles), Limebike, MoBike, Ofo and Spin. BlueGoGo, which was the first to roll out dockless bikes in the U.S., declared bankruptcy over the summer, per the 2017 report.
Knowing who rides is harder than counting rides. Most station-based systems collect some demographic data on annual or monthly pass holders but very little on one-time users. Dockless companies do not share demographic data, which makes it hard to get beyond anecdote.
Seattle’s pilot offers one workaround. Independent researchers at the University of Washington were employed to gather and analyse the data, which addressed the companies’ concerns about proprietary data and Washington’s FOIA laws.
Where bike share fits alongside other options
The figures above are from 2017, so treat them as a snapshot rather than a current picture. Systems, operators and prices have changed since then, and your own city’s operator is the best guide to what is on offer today.
Shared bikes work best when the street feels safe to ride, which is why protected bike lanes are worth reading about alongside this guide. If you need to carry children or heavy loads, cargo bikes for families cover a different kind of bike from the shared ones described here.
Frequently asked questions
Do I have to return a shared bike to a station?
Show answer
In a station-based system, yes: you take a bike from a dock and return it to a dock. Dockless systems have no fixed docks, so the operator’s rules decide where you can end a trip.
Which type of system is used more heavily per bike?
Show answer
In NACTO’s 2017 data, station-based systems averaged 1.7 rides per bike per day, against about 0.3 for dockless systems nationally. Seattle’s pilot reached 0.8 in the University of Washington analysis.
Are there cheaper options for lower-income riders?
Show answer
Many cities offer one. Among cities with station-based systems, 32% had an income-based discount program, and examples include a $5 AccessPass in Philadelphia and Detroit.
How many people used bike share in the U.S. in 2017?
Show answer
NACTO counted 35 million trips in 2017, 25% more than in 2016. The report does not give a count of individual riders, because demographic data on one-time users is very limited.